
Inside the system / Architecture
The big picture.
The important connections.
Two focused maps of a single-node k3s deployment. Open a diagram to explore the components, follow relationships and inspect the source behind each part.
A request, end to end.
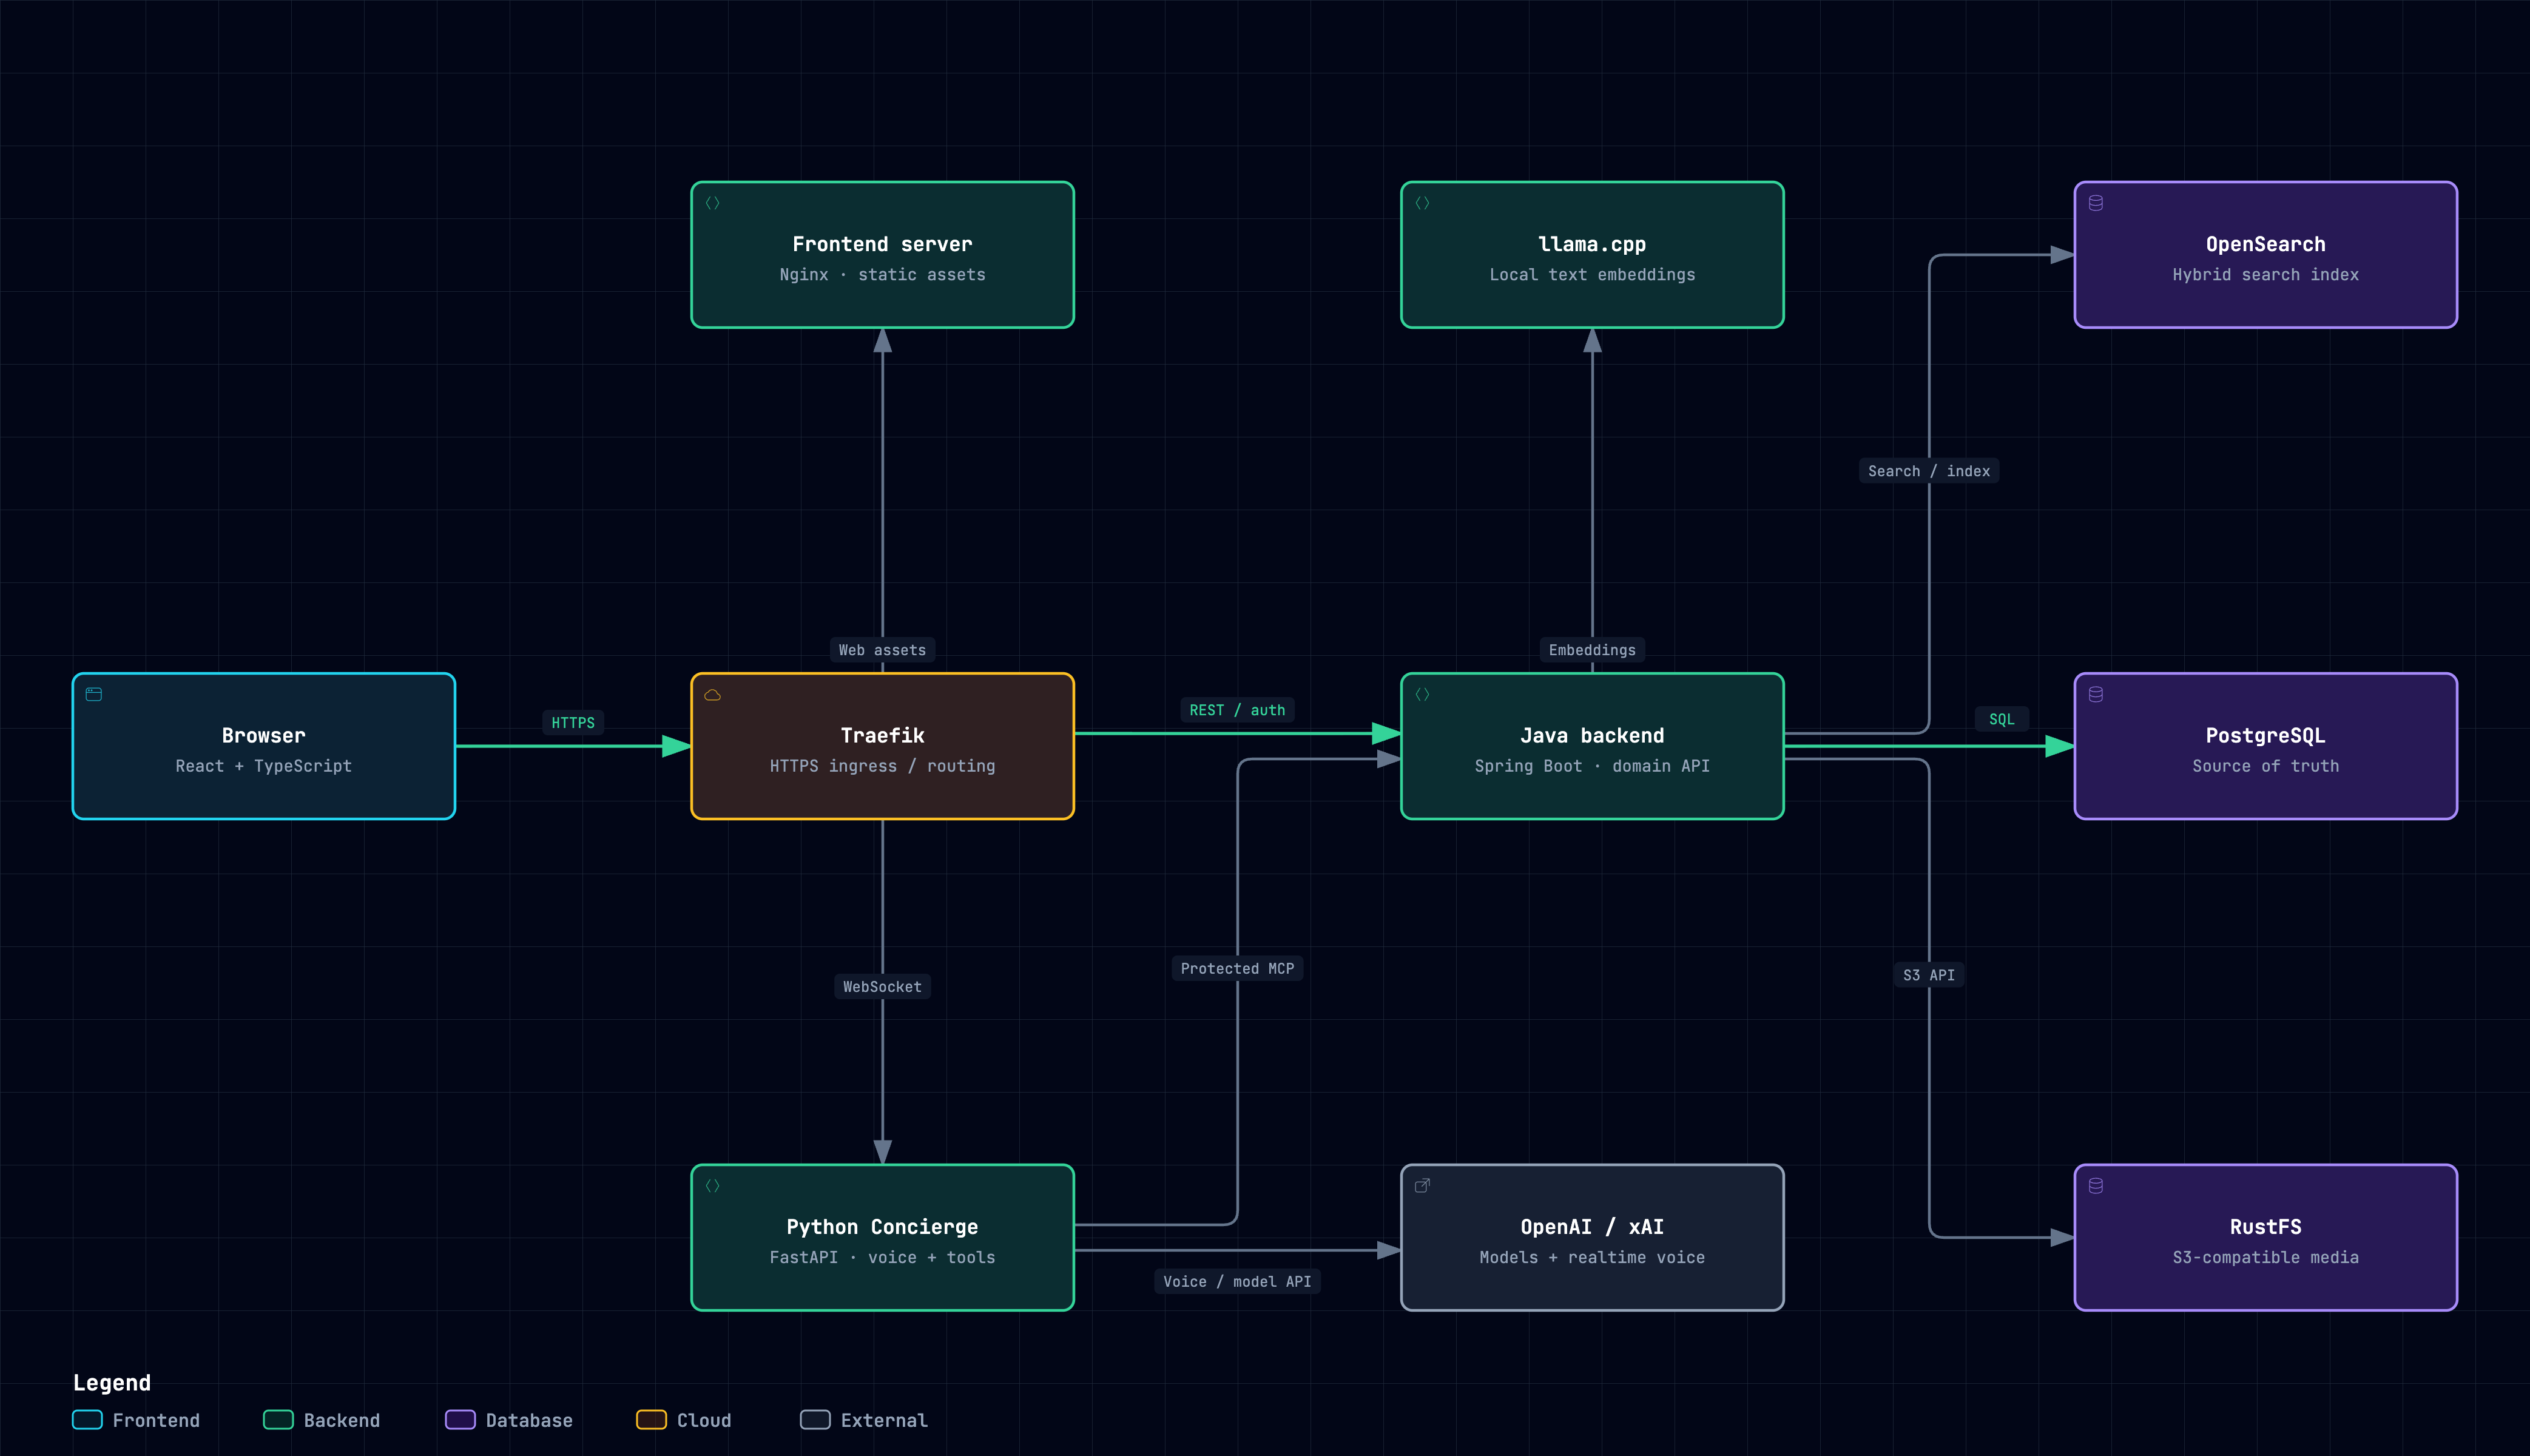
React provides the experience. Java owns the application domain. Python connects voice and model calls to the same protected domain capabilities.
Follow the main paths
- Browser → Traefik → Java → PostgreSQL
- Voice → Python → protected Java MCP tools
- Java → search index, embeddings and media
The interactive map opens in a new tab. Pan, zoom, switch themes or export a static image.
One owner for domain behaviour
The Spring Boot backend owns movies, accounts, ratings, watchlists and recommendations. The agent calls protected MCP tools; it does not query PostgreSQL or OpenSearch directly.
A deliberate overview
PostgreSQL is the source of truth; Java builds the derived search index. Public media delivery, OAuth providers, TMDB enrichment and certificate issuance are omitted to keep the main paths readable.
Four signals.
One investigation.
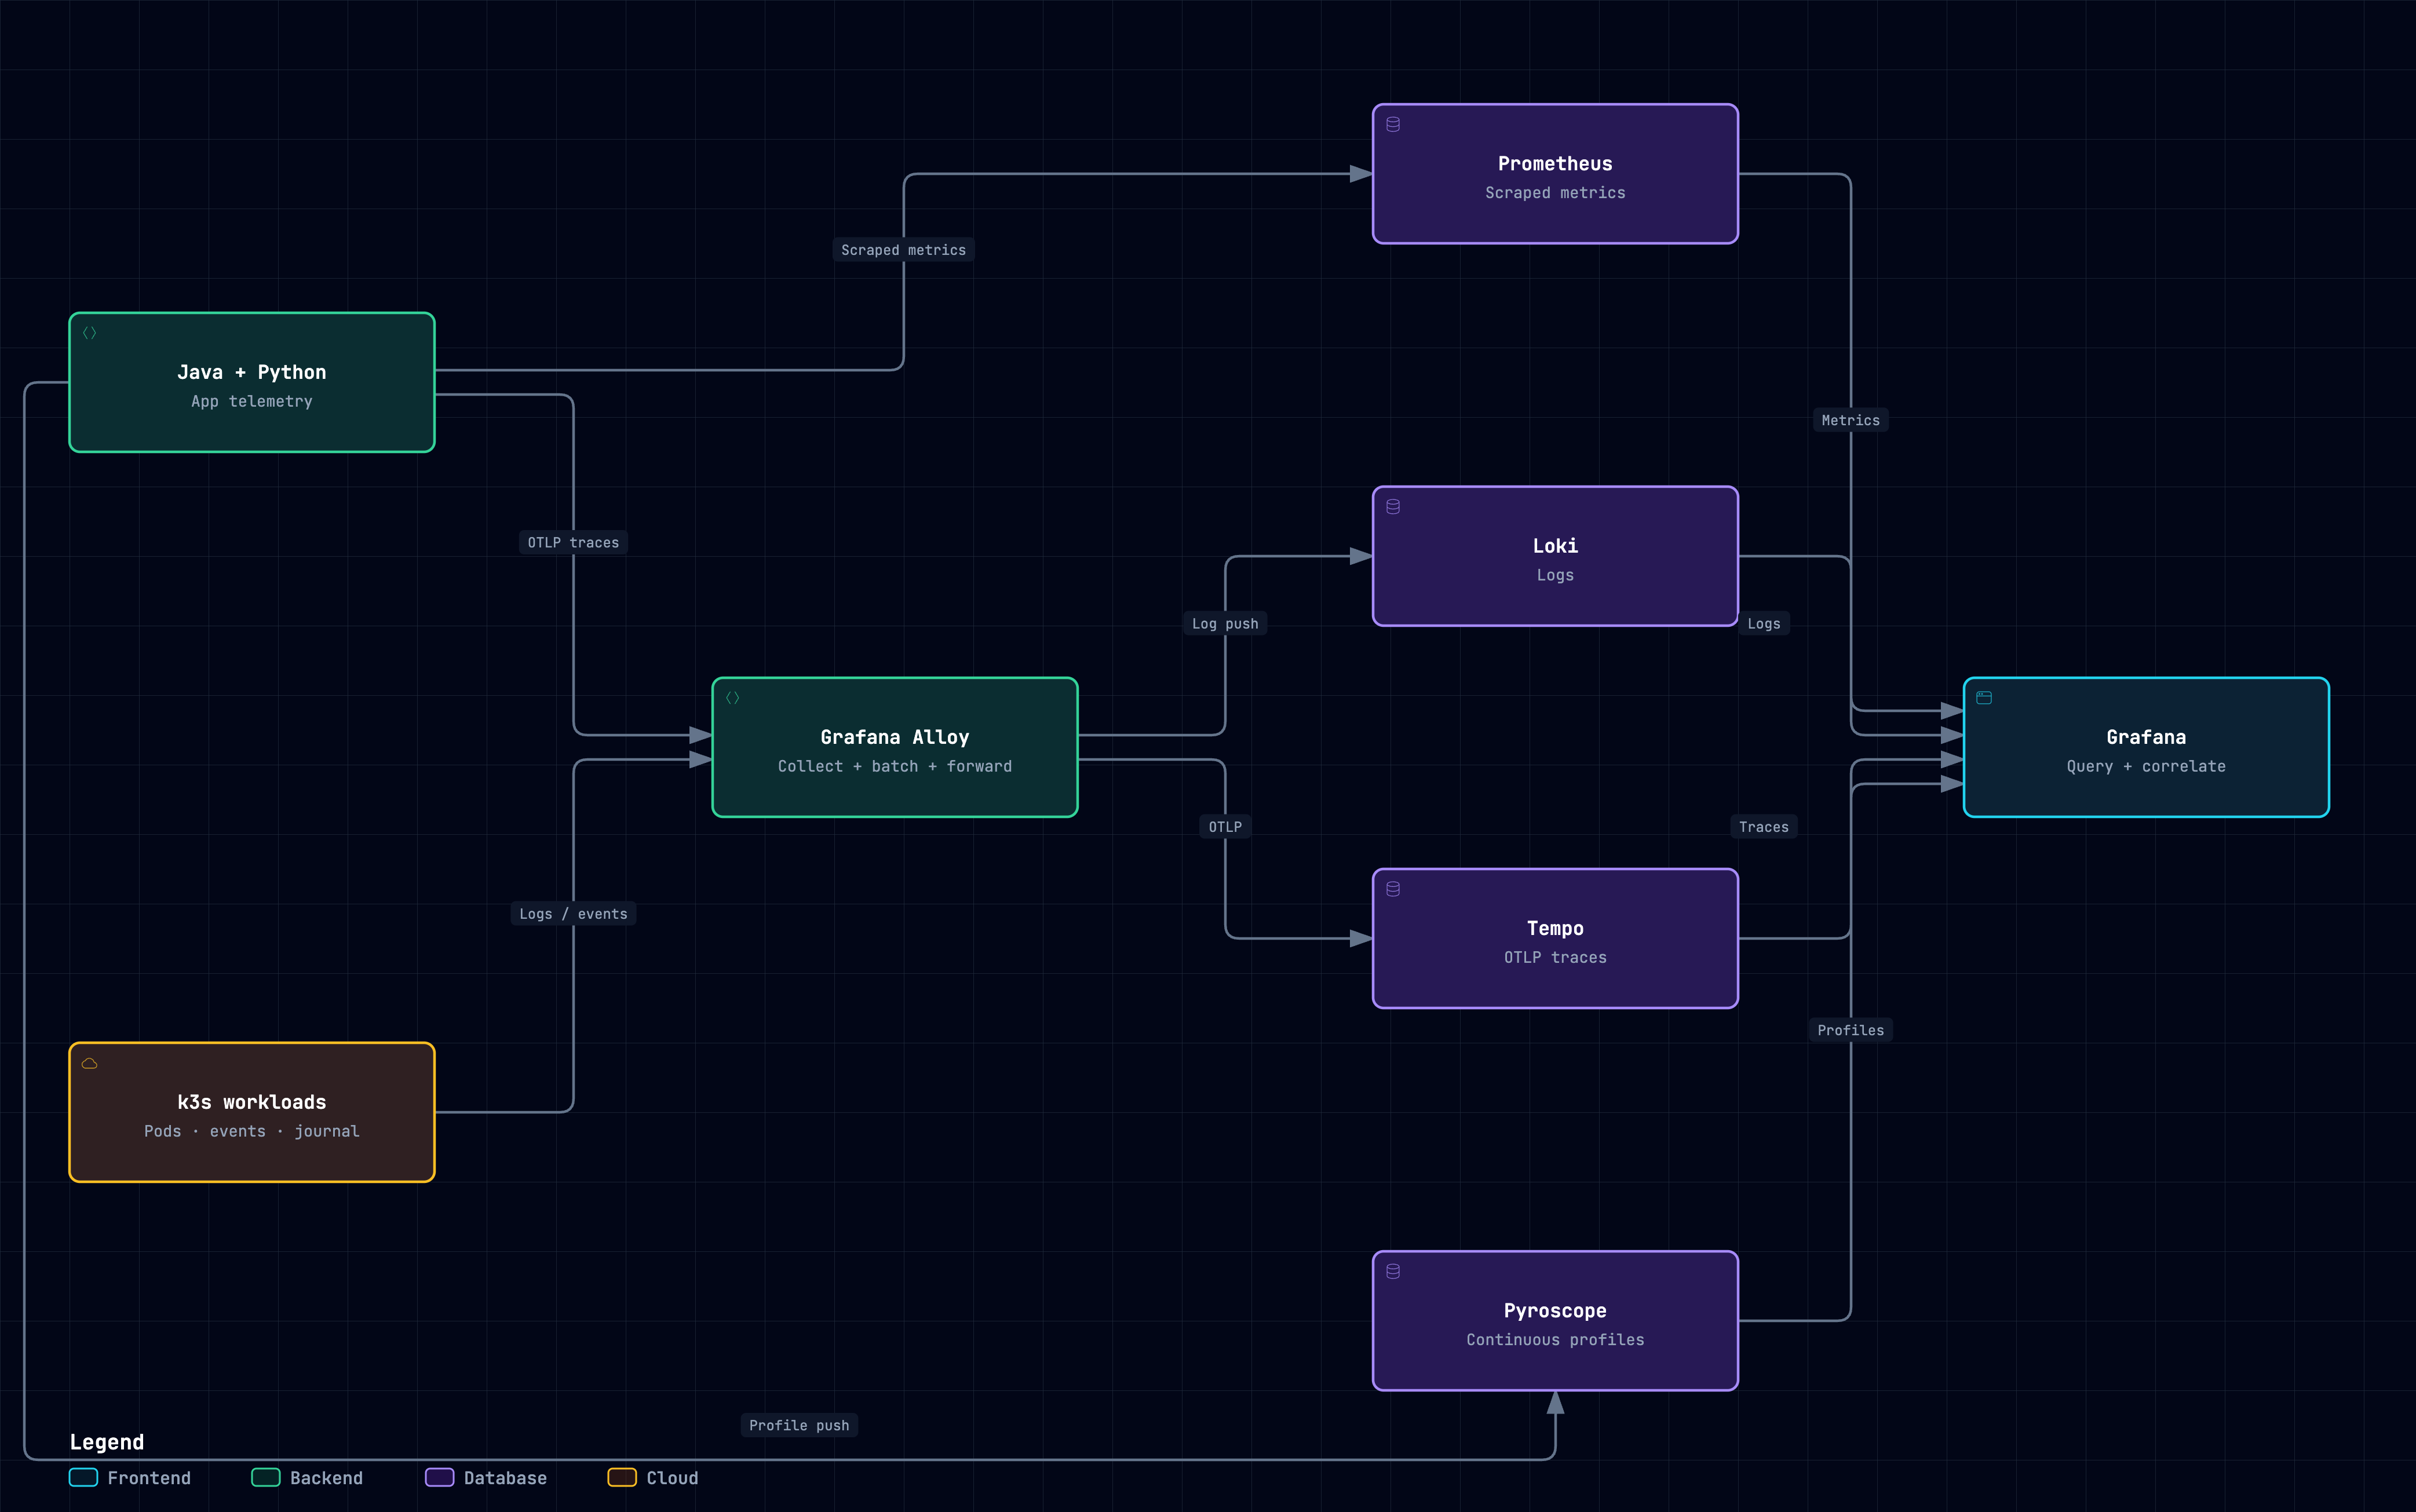
Metrics reveal a change. Logs and traces help locate it. Continuous profiles show where execution time and allocations are spent.
Follow each signal
- Metrics: application endpoints → Prometheus
- Logs and traces: Alloy → Loki and Tempo
- Profiles: Java / Python → Pyroscope
Arrows show the flow of telemetry and query results. Prometheus initiates metric scrapes; Grafana initiates queries.
Browser and infrastructure signals
The browser sends bounded timing and outcome batches to Java, which exposes the resulting metrics. Prometheus also scrapes cluster exporters, PostgreSQL and llama.cpp. Workload logs include the application containers and Traefik.
What this map does not claim
This is a view of the checked-in configuration, not a live health report. OpenSearch and RustFS currently have workload-readiness visibility, not native service metrics. Public dashboards are a future addition.
Reviewed September 17, 2026 · Repository baseline 8fbf5e17 · Diagrams generated with Archify. Each component links to its source evidence.